Financial Analyzer: From PDFs to Interactive Insights
Turn messy financial PDFs into analyzable, interactive insights. Upload a PDF, extract structured metrics via LLM Model, visualize trends, preview the exact PDF page for each data point, and ask contextual questions with a RAG-backed chat.
Try Out the Financial Analyzer
This document provides an overview of the Financial Analyzer's architecture, key features, and implementation highlights, focusing on the what and why rather than the low-level code.
The Challenge: Context and Consistency
Financial analysts spend countless hours manually extracting performance metrics from varying PDF report formats. This process is slow, prone to errors, and makes historical trend analysis cumbersome. Furthermore, when questions arise, analysts must manually search the source document for context.
The Financial Analyzer Solution:
- Structured Extraction: It uses LLM Model with a strict prompt contract to pull specific, canonical metrics (like "Total Net Sales") from any uploaded PDF into a clean, unified data format.
- Traceable Visualization: It charts the extracted time-series data and provides the ability to instantly jump to the original page in the PDF for verification.
- Contextual Q&A (RAG): It indexes the entire document library using FAISS to enable a chatbot that answers questions based only on the uploaded documents.
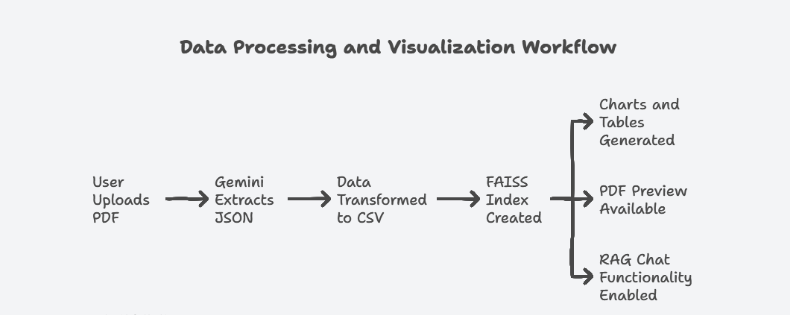
Data Processing and Visualization Workflow
Architecture and Key Design Choices
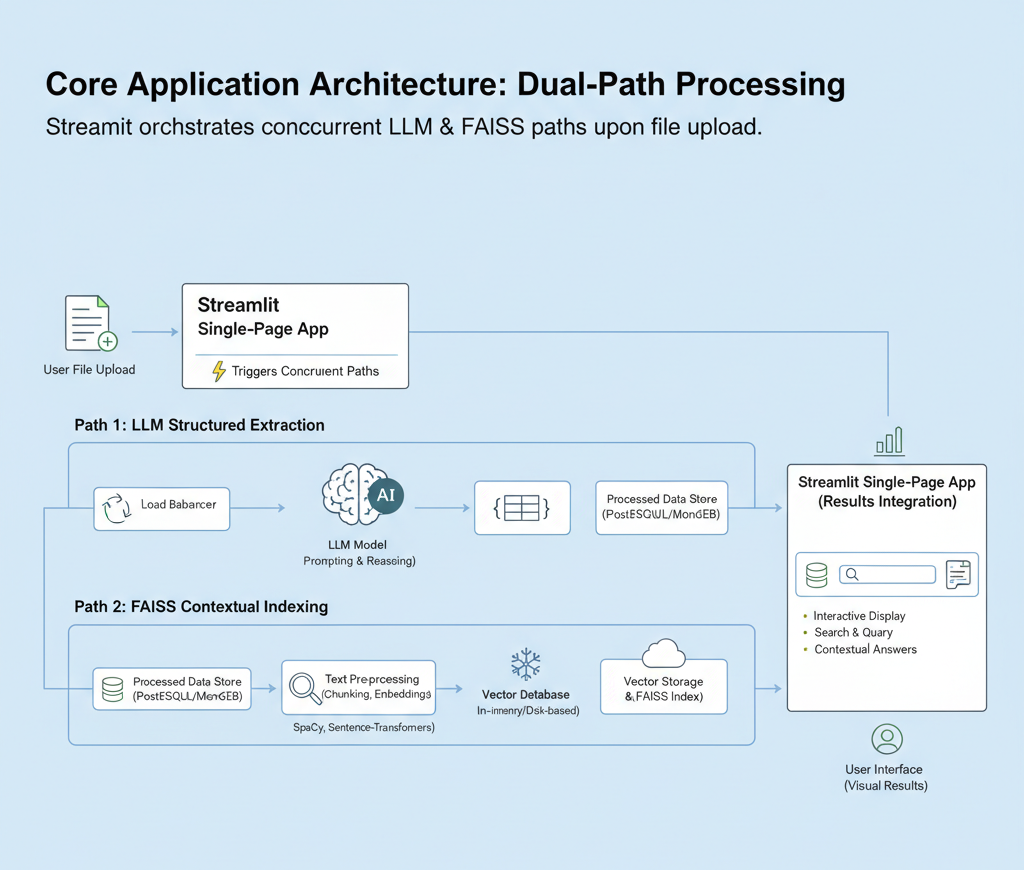
The application is built as a single-page Streamlit application in Python, designed for rapid prototyping and interactive data display. The key architectural decision was to create two concurrent processing paths upon document upload: one for structured data extraction and one for contextual indexing.
- Single-Page Orchestration: Streamlit manages the entire lifecycle, from file upload and processing status to visualization and the interactive chat window.
- Dual-Path Processing: Every uploaded document is immediately fed into both the LLM Model extraction pipeline (for structured data) and the FAISS indexing pipeline (for RAG context).
- Interactive UI: Uses Plotly for rich line charts and `st-aggrid` for customizable data tables, ensuring the UI is highly reactive to user input.
Core Application Architecture: Dual-Path Processing
Core Implementation Highlights
1. Guaranteed Data Quality via Strict Prompting
We use LLM Model's structured output capability to enforce a canonical JSON schema for all extracted metrics. This means we are not just asking the LLM to find numbers; we are demanding they be returned with standardized metric names and normalized month formats. This tight prompt contract drastically reduces the need for complex, fragile post-processing and ensures the time-series charts are built on reliable, consistent data.
2. Full Traceability (Data to Source)
A critical feature for analysts is the ability to audit the source of any number. The data grid is linked to a built-in PDF viewer. When an analyst selects a metric row in the table, the PDF viewer automatically jumps to the exact page from which that data point was extracted. This linkage ensures high trust and quick verification of the LLM's output.
3. Scalable Context with Incremental RAG Indexing
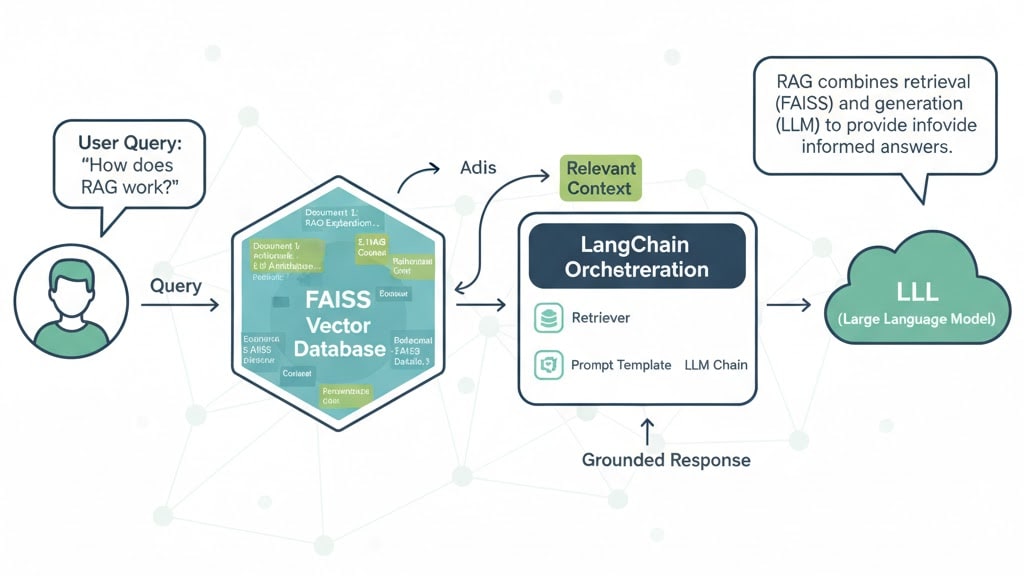
The Retreival-Augmented Generation (RAG) chat uses FAISS to store vectorized representations of the uploaded documents. To handle a growing library of documents efficiently, the system is designed to incrementally merge new documents into the existing FAISS index rather than rebuilding the entire index every time a new file is added. This ensures the chat feature remains fast and ready for grounded Q&A, even with many gigabytes of data.
4. Robust Data Persistence and Deduplication
For prototyping and a single-user environment, all extracted metrics are stored in a simple, readable CSV file (`financial_data.csv`). To maintain data integrity, the system implements a strict deduplication logic that prevents metric rows from being duplicated if the same document is uploaded or processed multiple times. This keeps the data history clean and the trend analyses accurate.
RAG Chat Workflow: From Query to Grounded Response
Performance and Usability Trade-offs
- Indexing vs. Quality: We chose a chunk size of 1000 for RAG indexing to balance retrieval quality (giving the LLM enough context) against index size and search speed.
- Latency Management: Since LLM Model extraction is an API call per document, which can introduce latency, the application uses visual spinners and status messages to inform the user that processing is underway, improving perceived responsiveness.
- Storage Simplicity vs. Scale: The reliance on local FAISS and CSV files works perfectly for a rapid prototype or single analyst, but moving to a proper database (e.g., Postgres) and a distributed vector store would be required for enterprise-level, multi-user deployment.
Running the Application
Usage:
- Upload a financial PDF in the left panel.
- Wait for the "Analysis complete" and "Data Stored in database" messages.
- Explore the line chart and per-metric tables.
- Click a table row to preview the exact PDF page.
- Open the "Ask Me" popover to chat with the document.
Future Vision and Scalability
- Secure API/Model Access (Closed Environment): To meet strict financial compliance standards, future iterations must route all LLM Model extraction and RAG calls through a secure, internal API gateway. This prevents sensitive financial data from being transmitted to external endpoints, effectively running the model in a "closed environment" or VPC (Virtual Private Cloud).
- Role-Based Access Control (RBAC): The current 'Access Control' will be formalized into Role-Based Access Control (RBAC). This implementation will grant explicit permissions based on user roles (e.g., Analyst, Admin, Auditor), governing document visibility, upload/deletion rights, and chat history access.
- Managed Document Repositories: Replace simple file upload with integrations to secure, managed document repositories (like SharePoint, Amazon S3, or internal file servers). This provides version control, audit trails, and automated ingestion pipelines for new financial filings.
- Full Database Migration: Moving away from CSV/FAISS to a secure, relational database backend (like Postgres) with a dedicated vector store to support thousands of documents and concurrent users.
- API Service Layer Decoupling: Introduce a stateless API service layer (e.g., built with FastAPI) between the Streamlit UI and the core processing logic. This decouples the application, enabling independent scaling of the UI, extraction, and RAG services.
- Multi-Document Analytics: Implementing tools to compare metrics across different companies or files, enabling sophisticated cohort analysis and benchmarking.
- Robust Error Handling: Introducing server-side schema validation on LLM output and automated retry logic to make the extraction process virtually failure-proof.
- Batch Processing: Integrating background workers (e.g., Celery) to handle large queues of document uploads asynchronously, ensuring the UI remains fast and responsive.
- Observability: Integrating structured logging, metrics (LLM latency, token usage), and error tracing for better monitoring and debugging in production.
Closing Thoughts
Financial Analyzer demonstrates the immediate, practical value of combining a powerful large language model like LLM Model with structured data engineering and modern search (RAG). By prioritizing traceability, consistency, and a strong user experience, the application transforms a tedious manual task into a fast, auditable, and intelligent workflow.